project update 4 - testing
Hi, in this post I will be covering my findings during the testing phase of the project.
I initially built the application on an AArch64 linux system, I had no issues building the file as per the github instructions under the POSIX section. I used perf report to profile the application.
but before I continue I should note that in all data obtained from tests used four this post on all platforms with the flags --verbouse --quality 84 on the application run.
I tested using a sample png file that was provided, I successfully converted and compressed the file from png to jpeg multiple times on both windows x86_64 and linux Aarch64 platforms.
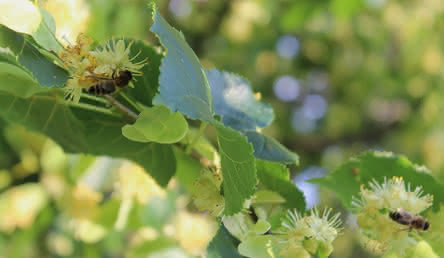
Before
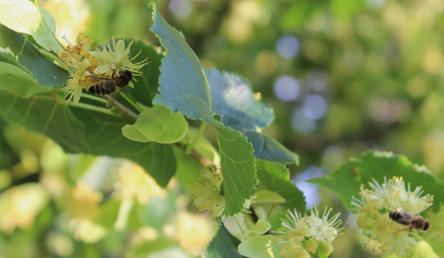
After
I should note that during my testing I did test with several other png images and some were rejected by the applications for reasons I have not yet narrowed down, this is an example of one such image. The choice of the specific image has no relavance to the test it just happened to be on my computer so I used it as test data aswell as many other images however this image did not work with the application as is no modifications made by myself. so its possible the application does have some bugs I need to be cautious not to worsen.

Now as for the results of the perf report it made it look as if butteraugli::Convolution
but the numbers were all over the place, it was clear the function was used frequently but the numbers were inconsistent enough to doubt the report.
I then moved my testing on the same source code with the visual studio profile tools on windows, I should make a note that all tests run using visual studio (with data used for this post) were in release mode win32 configuration and the profile was set to profile the application as an executable using the default cpu sample method.
I ran the same tests multiple times to try to see what kind of variation I already have during testing of the unmodified project
after 10 initial tests the total run time of the application ranged from a minimum of 14 secconds to a max of 17 and an average of approximately 15.5 seconds.
The tests confirmed that butteraugli::Convolution is where the most performance is used. ranging between doing 37% and 34% of the entire applications work. The remainder of the work seems to distribute fairly evenly among the other heavy functions.
I think there may be 3 reasons in the large variations in the baseline data, 1. It appears the application does not allays posses the data identically even with the same data on each run. IE some form of randomness in one of the operations affecting other decisions it is making, this is confirmed by the number of iterations it spends per compression not always being the same with each input and output. 2. the sampler could be missing some samples at times as the function is called in multiple places along the call tree, and 3 the deviations you would expect from other system resources being used by other applications during the test.
I also thing the nature of the call tree is why the perf report data was so difficult to read, because the function is being called indirectly and directly down multiple paths on the tree, some functions call it specifically and others call a function that call blur that in turn calls convolution. And blurr also has multiple call paths. Note in the image below I did not expand all relevant paths.

On windows x86 I could not observe any possible gains in performance from different compiler options then what was already set in the provided solution file, Additional testing on Aarch64 still needs to be done to see of the same is true on that platform. However I have tested on Aarch64 with the same default settings as with windows, the time to run is about 2 to 3 seconds longer on average then x86, however this simply could be that other users on that system caused more of a deviation. Over all very consistent results across both tested platforms.
My conclusion is that for maximum impact I need to find some way of optimizing the convolution function. However it may be difficult to optimize it any further then it may have been in the past. But for every 5% increase in performance to convolution we can expect a 1% overall increase, to get the same improvement in any other hot functions that don't also call convolution we would need at least a 20% increase for the same impact, There are a few candidates, most of them being whiten butteraugli.cc.
My conclusion is that increasing the performance is going to be difficult but possible and if successful our pessimistic expectation for increase should be 1% overall and our optimistic estimate is 5% overall increase.
Now 5% of 15 seconds is a 0.75 seconds, is it worth it? Maybe it will depend on how significant of a change is required. But in the context of this program existing on a server compressing potentially hundreds of compression requests at a given time. In that use case I would say yes the increase may very well be worth the effort.
I still require more testing not, for more profiling information but to aid in coming up with a viable method of having an impact.
Comments
Post a Comment